 |
Ryan McLaughlin | Mechatronics Portfolio
|


|
|
Ryan McLaughlin | Mechatronics Portfolio
|
|
In the first week of the final project, our main goal was to learn how to send data via serial.
Previously, having only a Nucleo developement board, we were only able to use one USB port to send/recieve data. However, with the new hardware arriving, our new setup included two USB ports: one on the board itself, and another connected directly to the board MCU that we refered to as the "native" USB port. This allowed for seperation of debugging in the Putty window from user interface print statements in Python, an invaluable upgrade to our previous workflow. The following sections below outline in more detail some of the files created in week 1.
To begin this lab, we needed to write a script to send and recieve data to and from the Nucleo board. Simplicity was a main key in the end for this script, as unlike some of the other code we have written, a finite state machine structure is not neccesarily needed. For full documentation of this file, see frontEnd.py.
Note: All documented files are final versions.
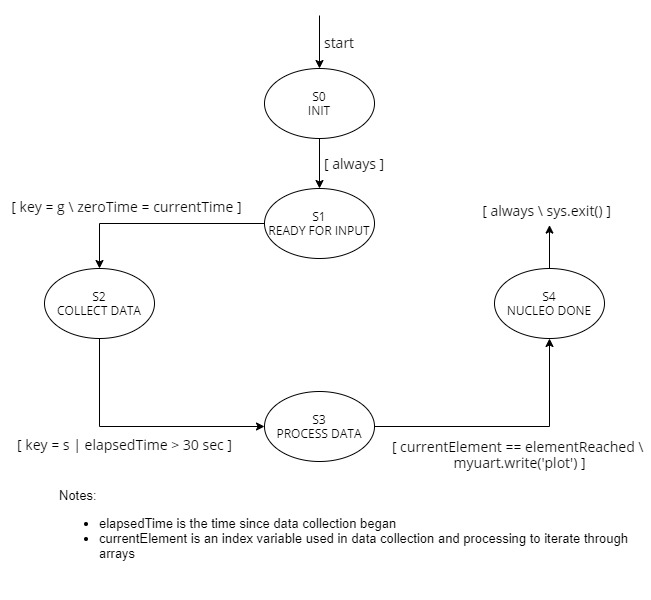
To go along with the aforementioned script running in Python, we need a task running on the microcontroller board to facilitate serial communication. As other tasks such as encoders, motors, and controllers (discussed in more detail in weeks 2-4) are running, the UI Task runs at a faster period, and is in control of data collection, sending data back to the PC, and translating commands sent from the PC. Since there are many different phases of system operation (initialization, collecting data, transmitting data, etc.), a finite state machine has been implemented for this file, and the corresponding state transition diagram is shown below. For full documentation of the final version of the UI Task, see uiTask.py.
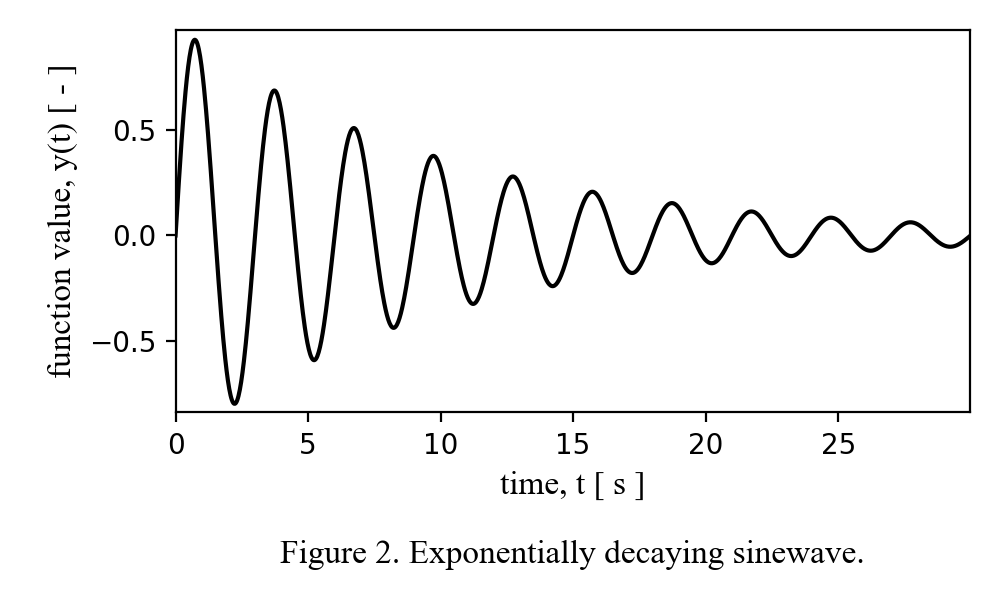
Lastly, our week 1 deliverable was to sample and collect data from an arbitrary decaying sinewave function on the Nucleo, send it to the PC through serial, and finally plot the data using matplotlib on the PC side. This final plot is shown below in Figure F.2, and is a preview into the larger picture goal of creating plots based on encoder data, not just a predefined function.
Click here to advance to Week 2: Interfacing with Encoders.